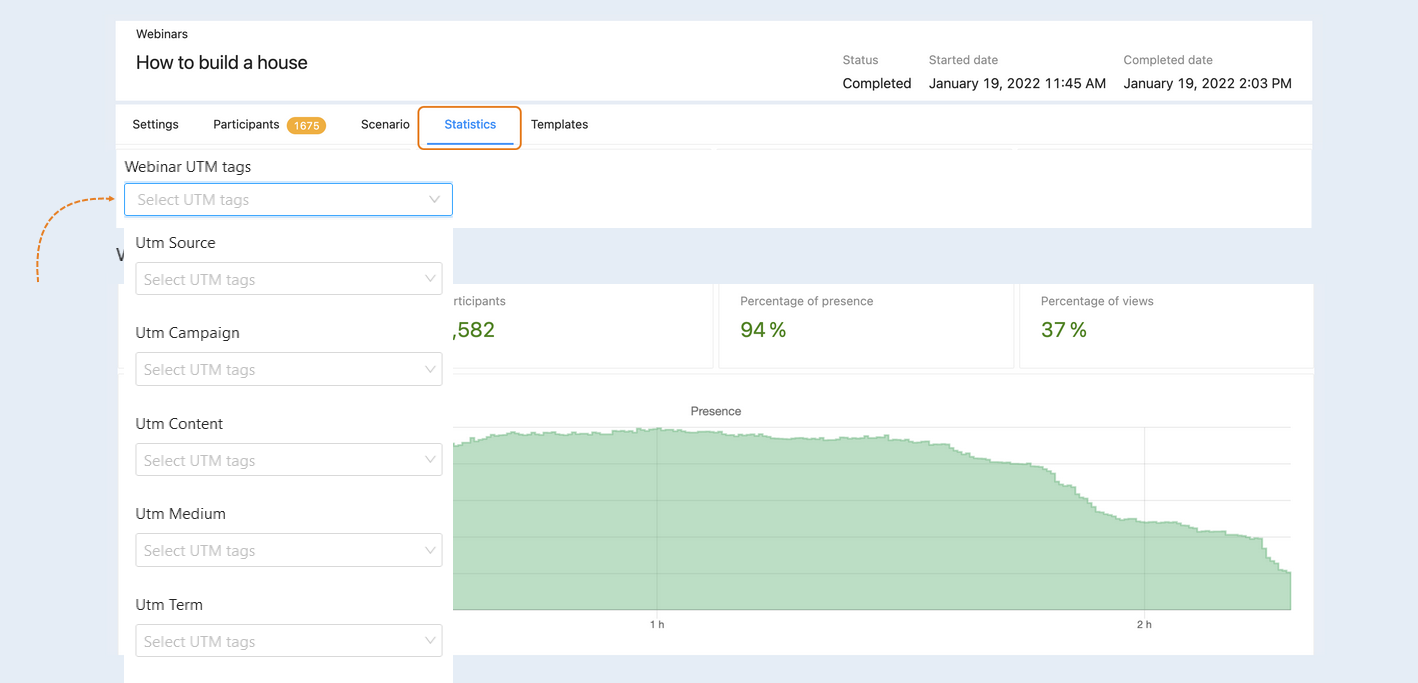
The Statistics section is an analytical tool that provides detailed information about the effectiveness of a webinar. It allows you to evaluate how successfully the webinar has achieved its goal. This section is necessary to understand what worked well and what can be improved in future webinars. Statistical analysis helps optimize the content, format, timing, and ways to promote webinars in order to increase their effectiveness and impact.
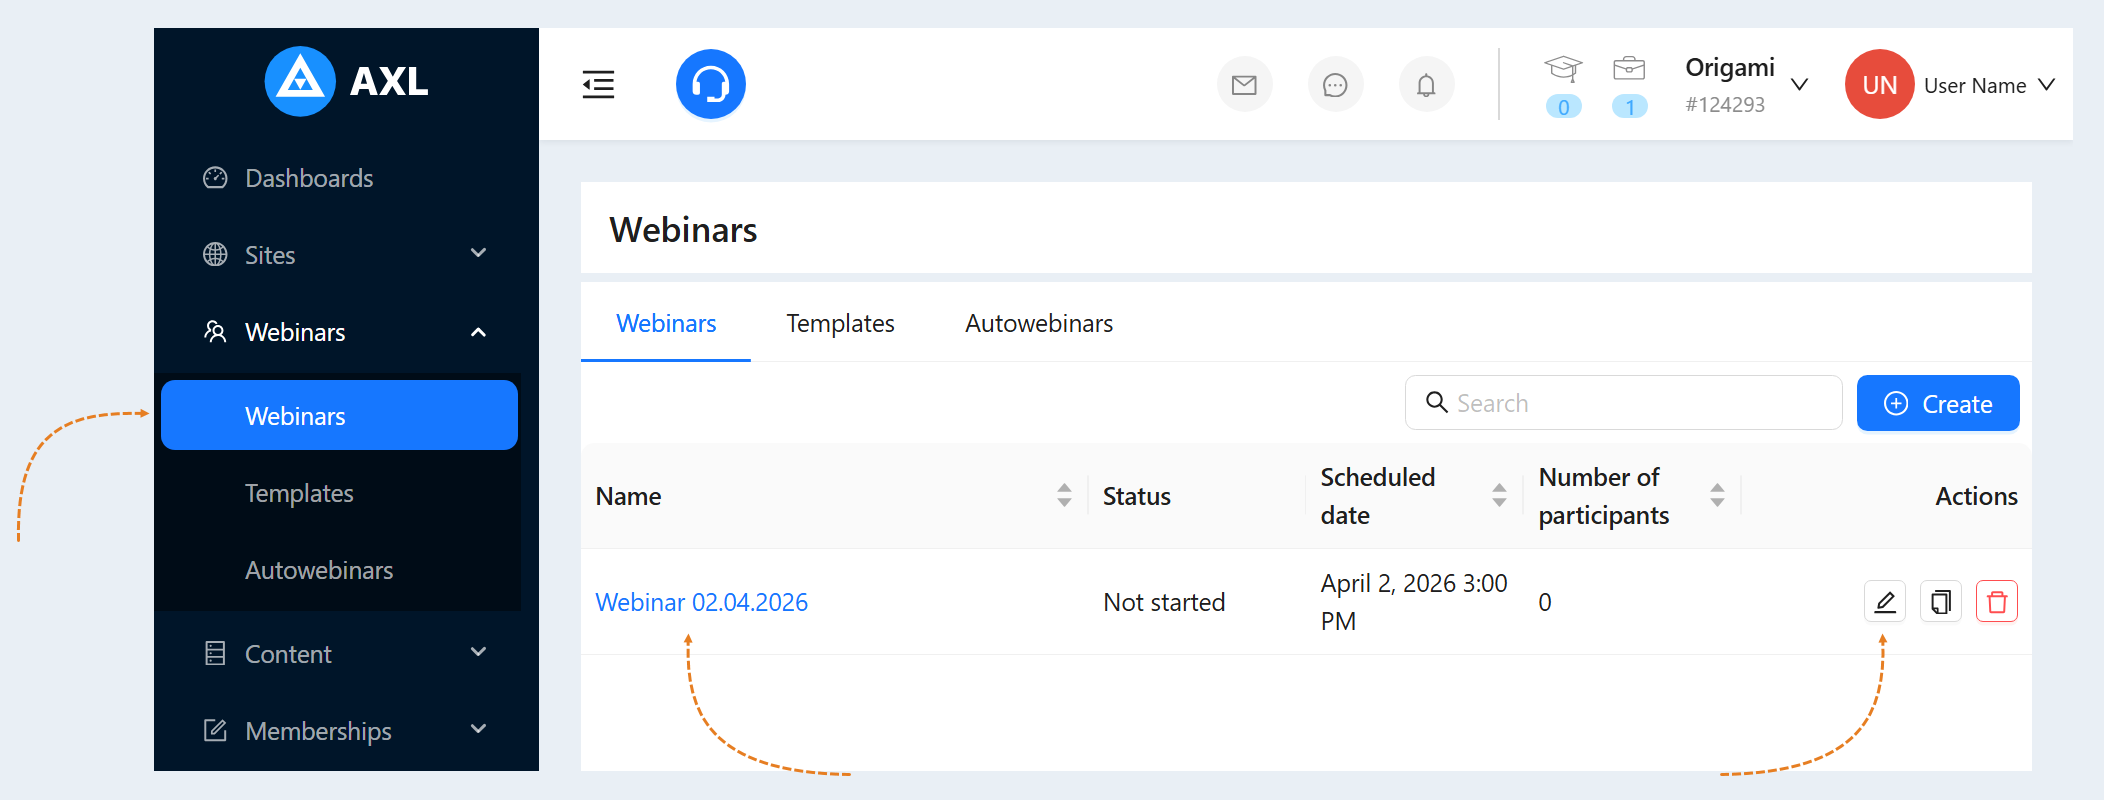
Go to the "Webinars" section. Click on the webinar title or the "Edit" button.
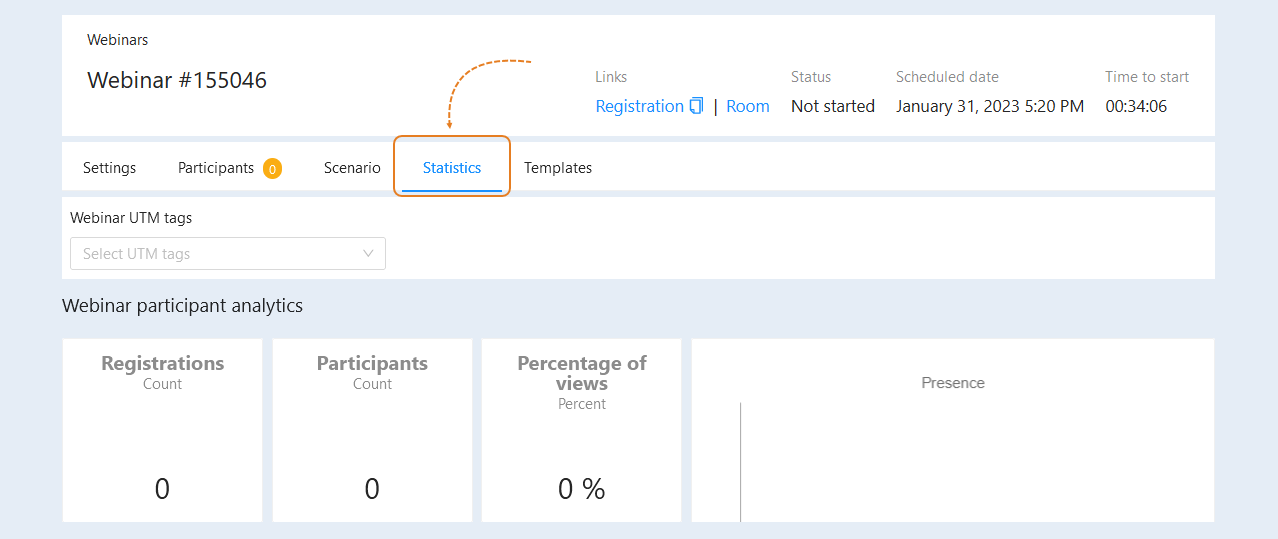
Go to the "Statistics" section.
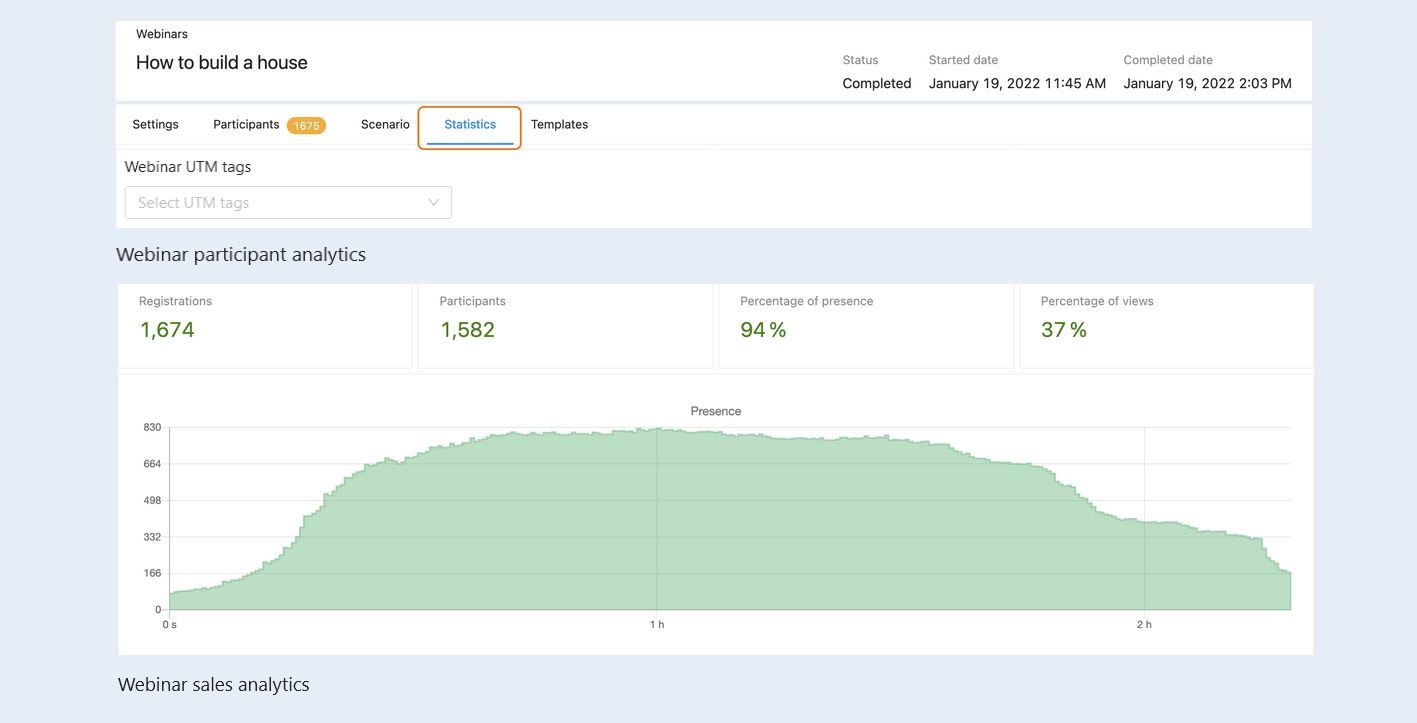
Here you can see detailed statistics of the webinar. Webinar participant analytics:
Registration. Here you can see the number of users who have registered for the webinar. This indicator reflects the interest in the topic of the webinar and the effectiveness of marketing efforts to promote it. The more registrations, the wider the potential audience.
Participants. In this tab, you can see the number of users who actually attended the webinar. This indicator shows how many registered users actually came to the webinar. The difference between "Registrations" and "Participants" allows you to assess how much registration is converted into a real visit.
Percentage of presence. Here you can see the average percentage of the time that the participants spent on the webinar from its total duration. This indicator reflects the level of audience engagement and the quality of the content. A high percentage of attendance indicates that the participants are interested and helpful.
Percentage of view. Here you can see the number of webinar views from the beginning to the end as a percentage of all those present at the webinar. This indicator demonstrates interest in the topic of the webinar.
Presence. In this tab, you can see a graph showing how the number of webinar participants has changed over different time periods. This graph allows you to identify the moments of the webinar when the audience was most actively involved (peaks on the graph) and when interest began to fall (falls on the graph). This information helps optimize the structure of the webinar and the content to keep the audience's attention.
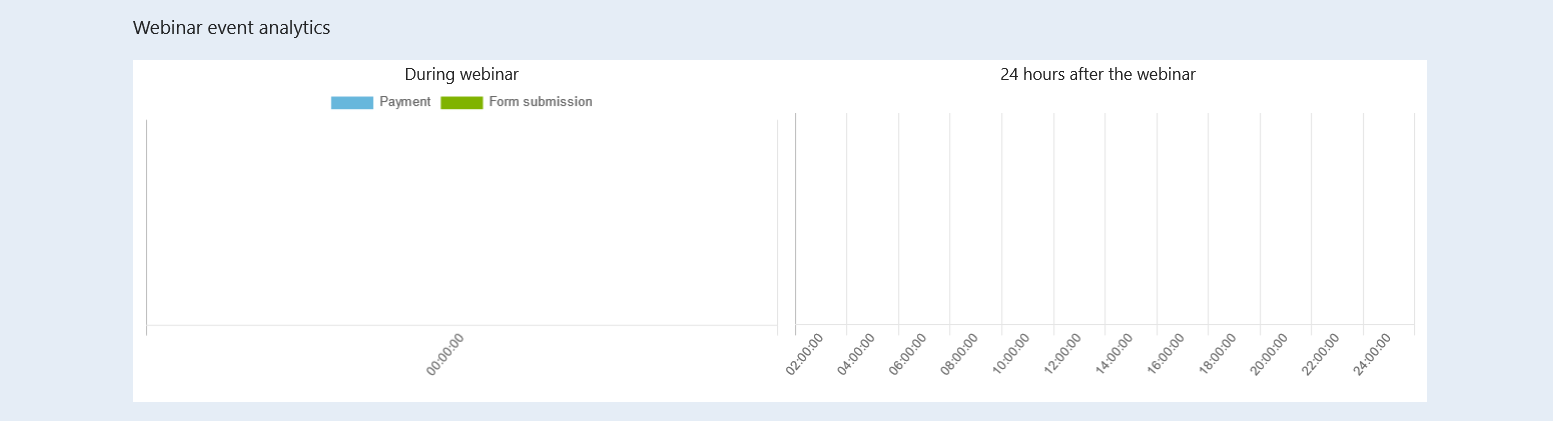
Below is a detailed Webinar event analytics. The graph reflects statistics on payments and form submissions.
Analytics during the webinar helps track participants' activity, engagement, and response to the presented material. This allows evaluating the effectiveness of the presentation, holding the audience's attention, and adapting the information delivery in real-time.
Analytics 24 hours after the webinar is equally important as it helps assess participants' overall impression of the event, their satisfaction, as well as conversion into long-term goals such as sales, subscriptions, and other actions. Based on the analytics, conclusions can be drawn about the success of the webinar and determine further development strategies.
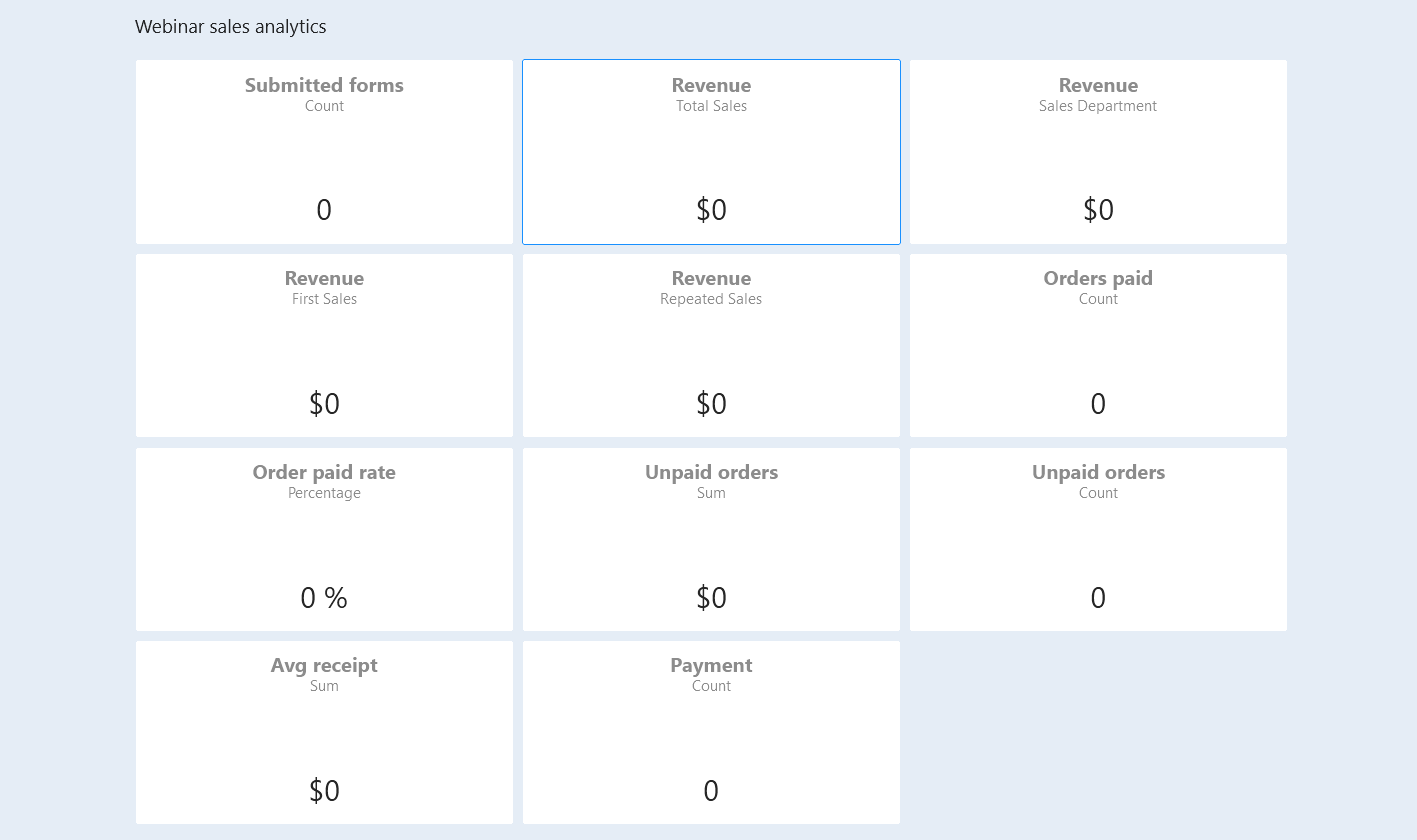
Below is a detailed Webinar sales analytics.
This is a data analysis of sales that occur as a result of a webinar. It includes information about the number of forms submitted, revenue generated, paid and unpaid orders, as well as average order value.
Webinar sales analytics help understand the effectiveness of hosting the event and determine how successful the sales were. It helps evaluate the effectiveness of marketing efforts and the efficiency of funds spent on the event. Overall, it helps companies plan and analyze their events more effectively in order to increase profits and improve results.
For easy searching and analytics, use the webinar UTM tag filter.
UTM tags (Urchin Tracking Module) are parameters added to a URL to track the effectiveness of a specific marketing campaign or traffic source leading to the webinar registration or broadcast page.
Main UTM parameters:
- Utm Source. Traffic source. A required parameter. Indicates the platform or website from which the user came (e.g., facebook, google, newsletter).
Utm Campaign. Campaign name. A required parameter. Used to identify a specific marketing campaign (e.g., spring_sale, webinar_promotion).
Utm Content. Content. Used to differentiate between different ads, banners, or links within the same campaign (e.g., image_version_1, text_headline_2).
Utm Medium. Traffic type. A required parameter. Describes the type of marketing activity (e.g., cpc - cost per click, email, banner).
Utm Term. Keyword. Used to track keywords in paid advertising.