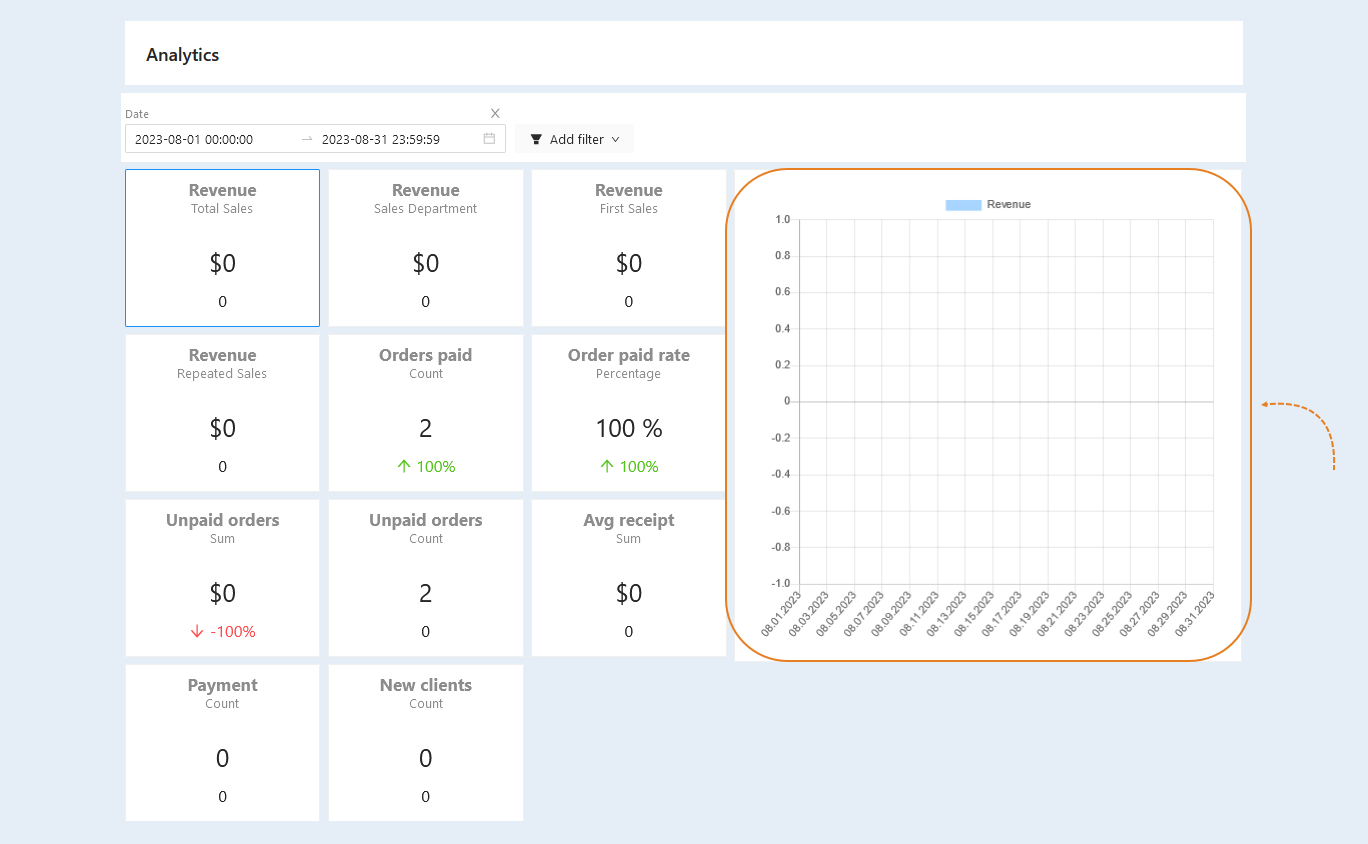
Sales analytics is a section of AXL, where tables and graphs are presented that visually display the sales volume of your products and the amount of revenue for the selected period. Analytics show how the sales process in your account is going.
In the "Sales Analytics" section, you can see the amount of revenue, paid and unpaid orders, the number of new customers, payments, average check and more. Based on this data, you can evaluate how your account is performing and make a plan to increase revenue.
Go to the "Analytics" section, "Sales Analytics" tab.
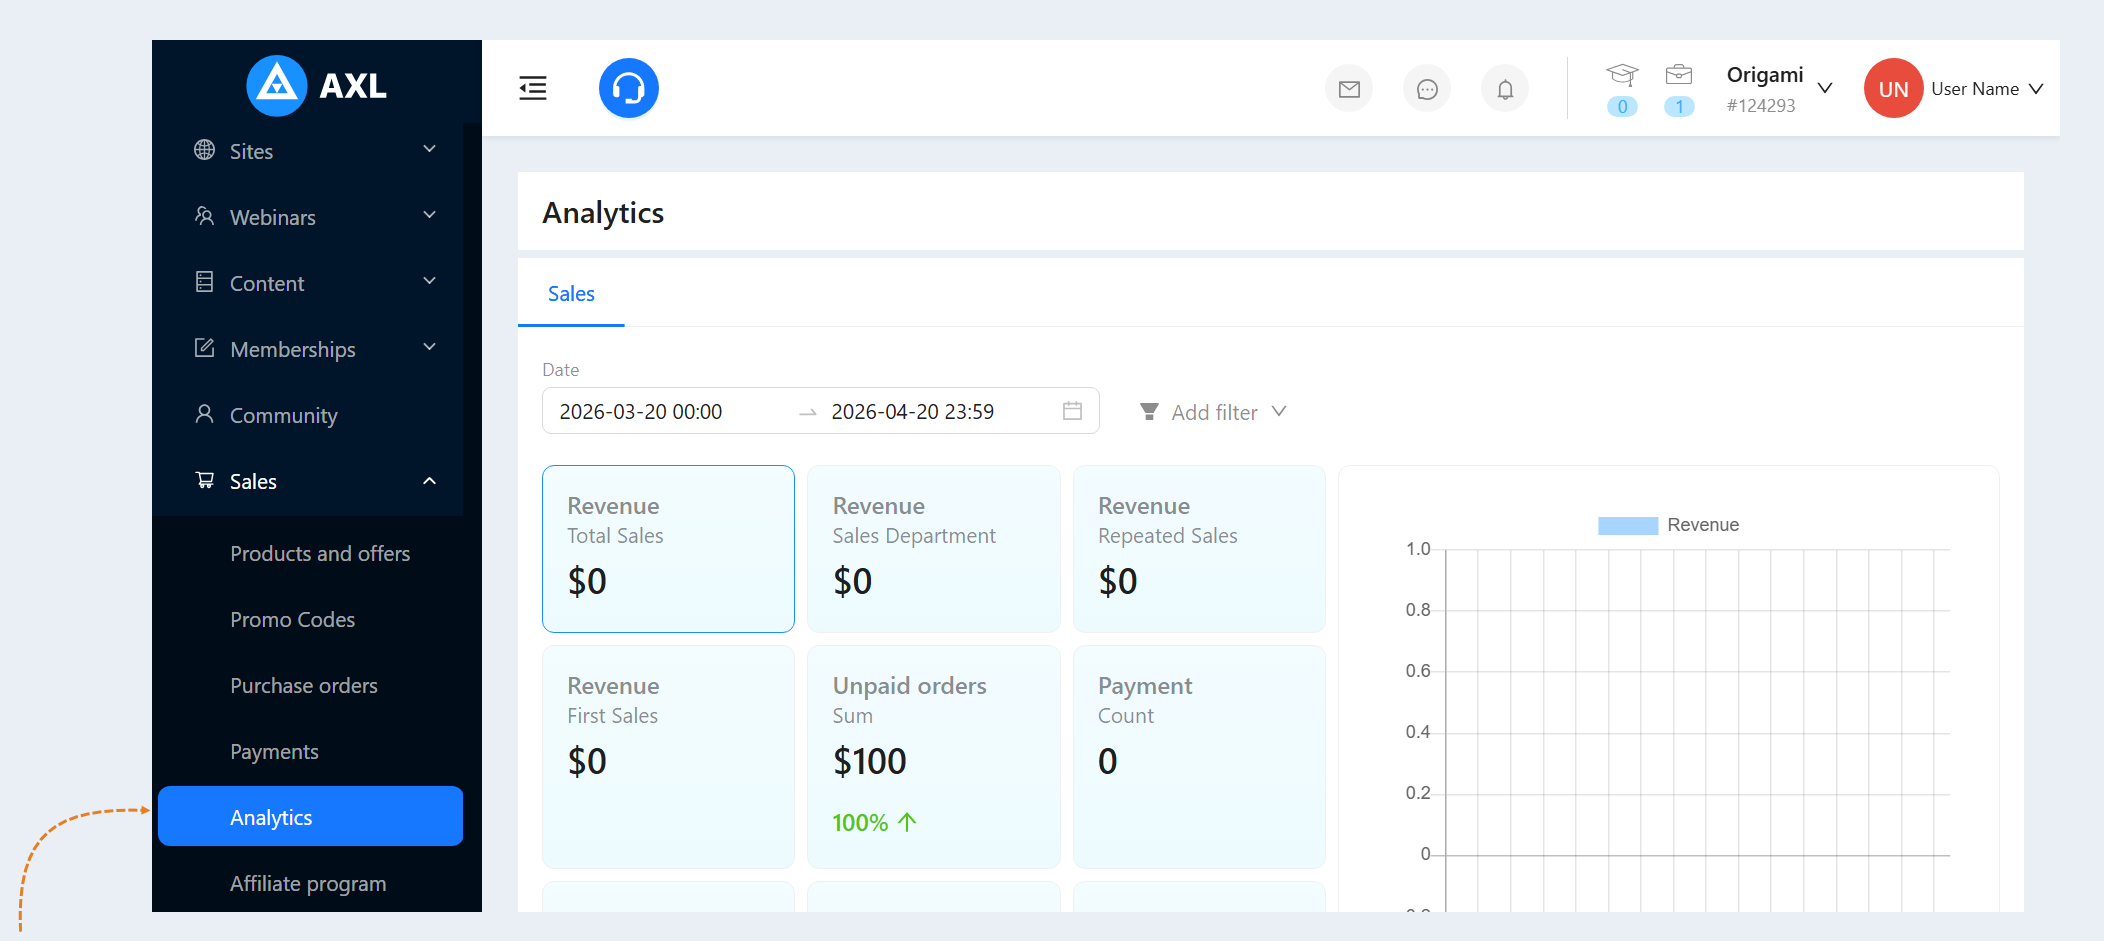
At the top of the page are the search lines:
- Date. Set the time period.
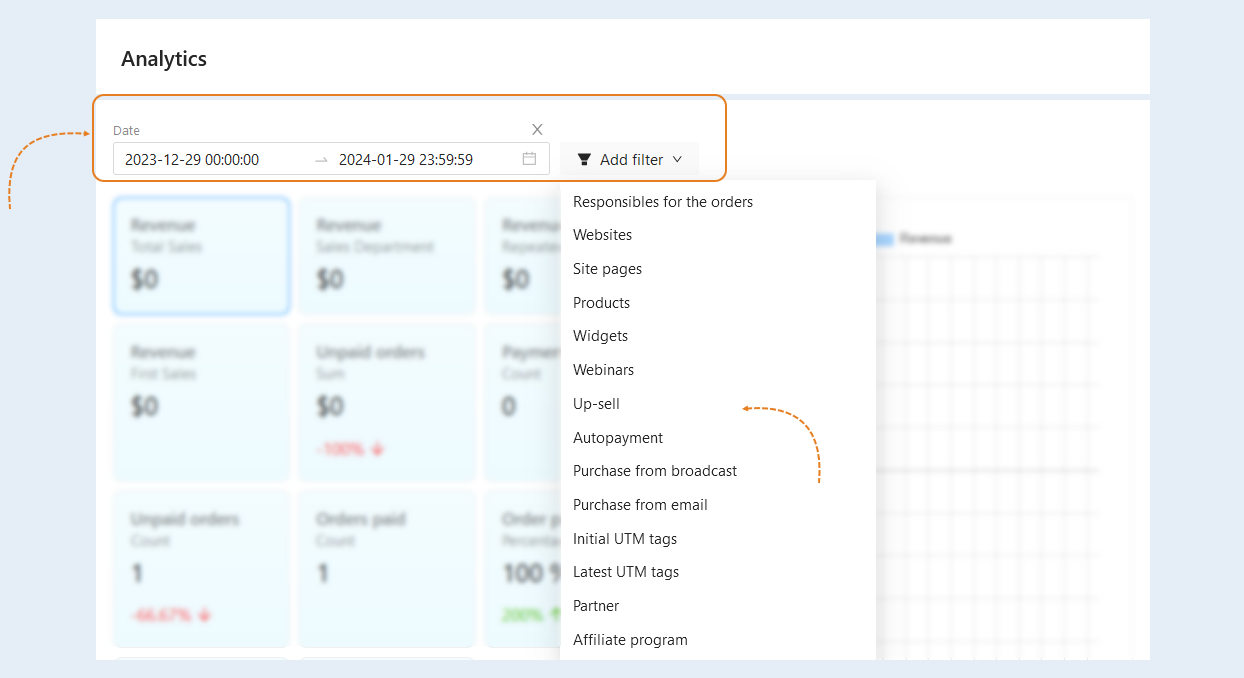
Add a filter. Each condition is designed for deeper and more precise filtering of sales data. Click the "Add Filter" button and select a filter condition from the list:
Responsible for orders. Allows filtering data by specific employees or managers responsible for processing or fulfilling orders. This helps evaluate the performance of individual specialists. Select one or more employees from the list.
Sites. This condition allows you to select the websites where sales were made. Choose sites from the provided list.
Website Pages. Filters data by specific pages where purchases were made. This helps identify which pages convert better and where the most interested users come from.
Product Type. Allows you to filter sales by product categories (e.g., digital product, service, subscription, etc.), helping to identify the most popular types of offerings.
Products. Filters data by specific products and services. This can help identify the best-selling and least popular products.
Product Categories. Allows you to analyze sales performance across different categories, aiding in strategic planning and inventory management.
Widgets. Select widgets from the list. This condition helps determine which sales widgets are the most effective.
Webinars. Allows you to analyze sales related to webinars, helping to evaluate their effectiveness as a sales tool. Select a webinar from the provided list. To sort through a large number of webinars, you can choose the webinar type in the dropdown's bottom line: live, template, auto-webinar, or all.
Up-sell. This condition highlights sales where up-selling was successful (e.g., purchasing additional courses or services). This helps understand how actively up-selling is working.
Autopayments. You can sort sales analytics separately for auto-payments. Highlights sales where payments occur automatically. This can help assess stable income levels.
Purchase from broadcast. This condition highlights sales made through email newsletters, allowing you to evaluate the effectiveness of marketing strategies.
Purchase from Email. You can sort sales analytics separately for purchases made via email. This is important for analyzing responses to email campaigns.
Initial UTM Tags. Allows you to analyze traffic sources and marketing campaigns, determining where customers came from and which channels were the most effective. You can specify a UTM tag value to select only those orders where associated contacts clicked on that UTM tag to reach your site.
Latest UTM tags. Similarly, this tracks the last tags before a purchase, helping to understand how final touchpoints influence conversion. Select the last UTM tags from the list.
Partner. Highlights orders associated with a specific partner or multiple partners, helping to evaluate the effectiveness of the partner network.
Affiliate Program. This condition highlights orders created within an affiliate program.
Sale at free price. Filters transactions where the customer sets their own price. This can help analyze pricing flexibility and strategies.
Subscription Mode. Highlights specific subscription modes, allowing for more detailed data analysis:
- Trial Period. All sales or subscriptions made during a trial period (e.g., free access for a limited time). Helps analyze how many users were interested in the product and started using it on a trial basis.
Renewal After Trial Period. Subscriptions that were renewed after the trial period ended. Helps evaluate how many users decided to continue using the product after the trial. This is a key metric for analyzing customer retention success.
Full Payment. Subscriptions that were purchased without a trial period (the user paid for full access immediately). Helps identify users who are ready to pay for services upfront. This can be useful for analyzing loyal or highly motivated customer segments.
Non-trial period extension. Subscriptions that were renewed but not after a trial period (e.g., the user renewed the subscription after the paid period ended). Helps analyze how many users continue using the product after the paid period.
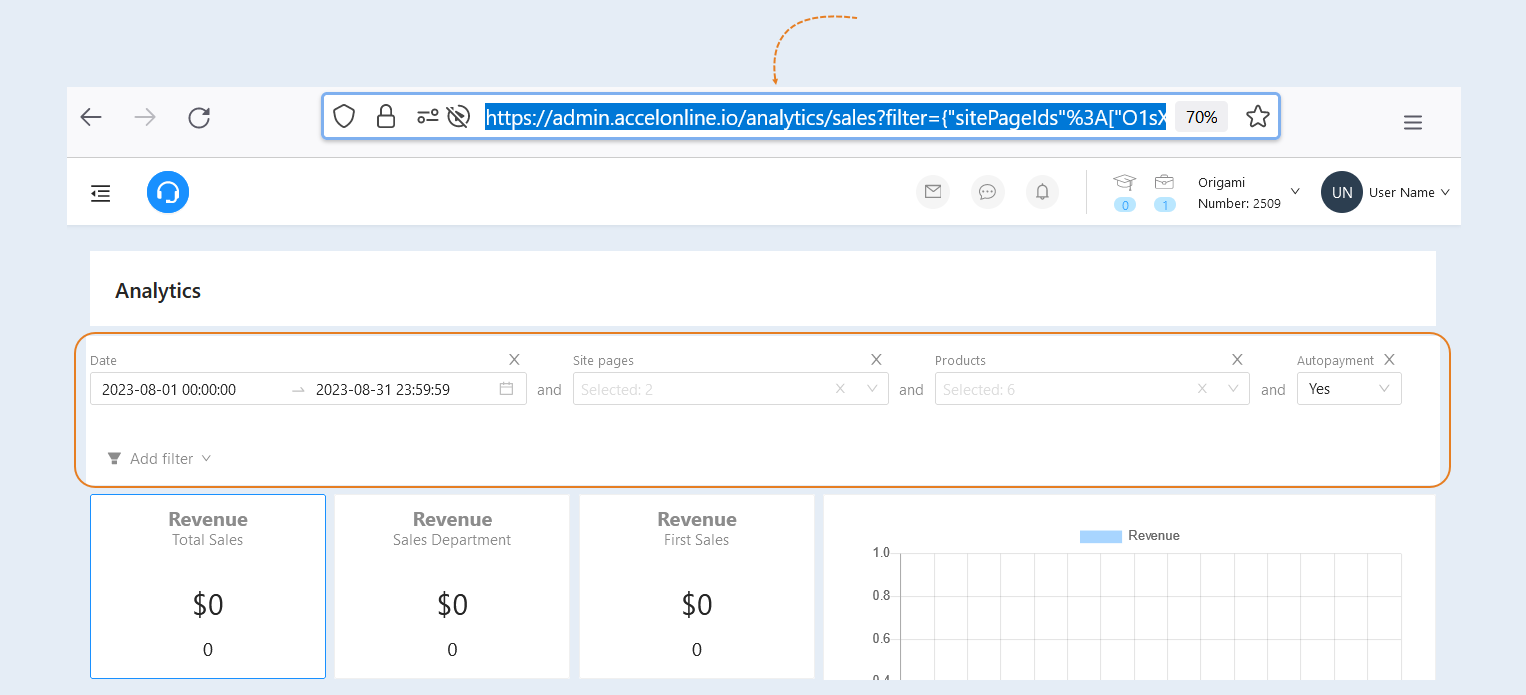
By choosing different filter conditions, you can create a “set” filter. The "set" filter will be saved in the page address. You can copy the address of the page and save it for future use. Or you can forward the address of the page to your employees. If an employee follows this link, the sales analytics window will open with the "set" filter you created.
On the left is the sales data:
- Revenue: all sales, sales team, first sales, repeat sales.
- Paid orders: quantity, percentage.
- Unpaid orders: amount, quantity.
- Average reselpt.
- Payment.
- New clients.
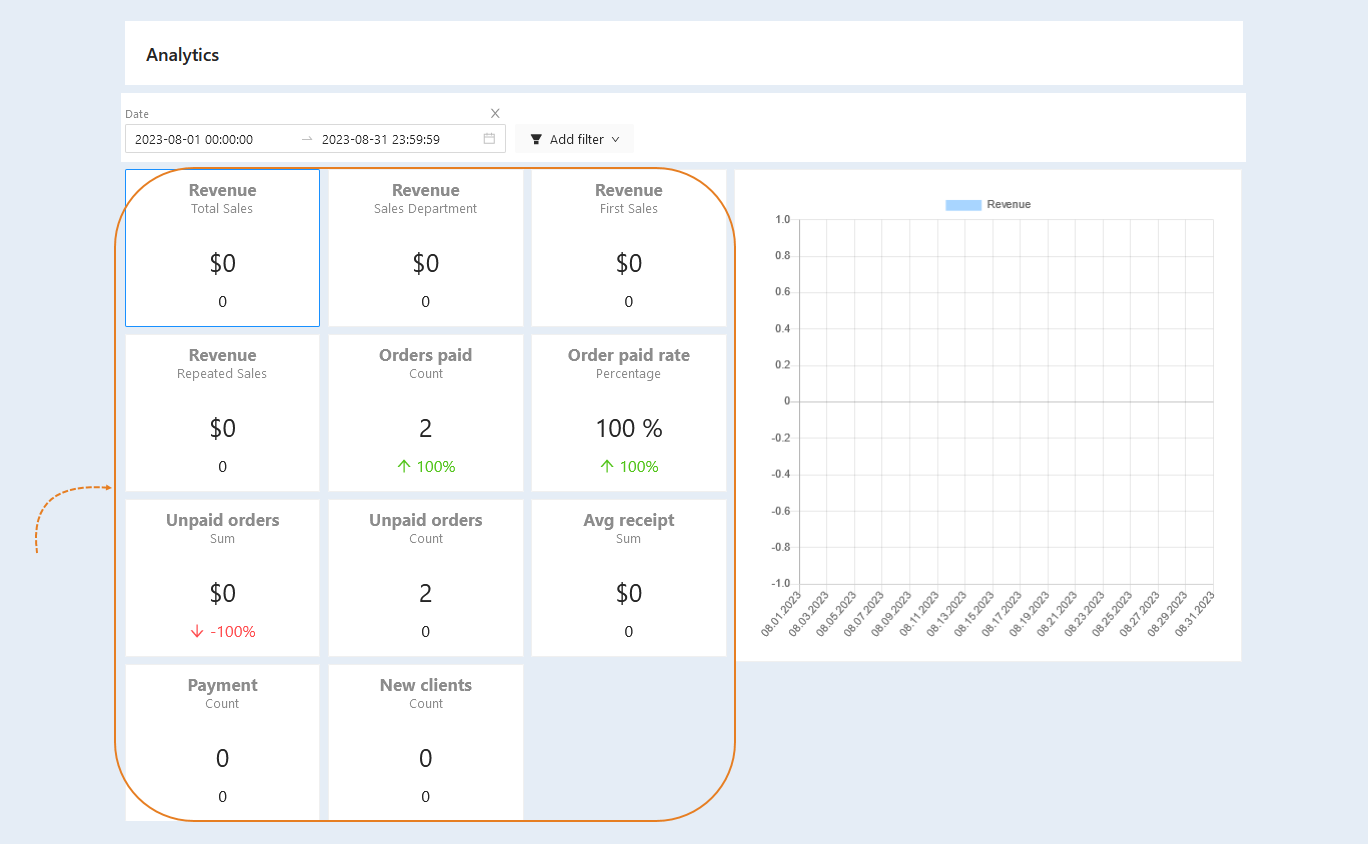
On the right side of the chart, you can see visual statistics for each card.