Analytics is a web visit analysis tool that helps you track the conversions of your funnels and measure the effectiveness of your ads.
With the help of analytics, you can track the traffic statistics of your web pages, compare one site with another in order to understand which site most effectively conveys information to the visitor and is more attractive.
You can view which channels of attracting people to the site give the greatest response, and which, on the contrary, do not bring results and it is better to refuse them. By doing a comparative analysis of attendance, you can find working channels for attracting traffic and focus on them in your work.
Click on the desired section of the article to go to its description:
Website traffic analytics
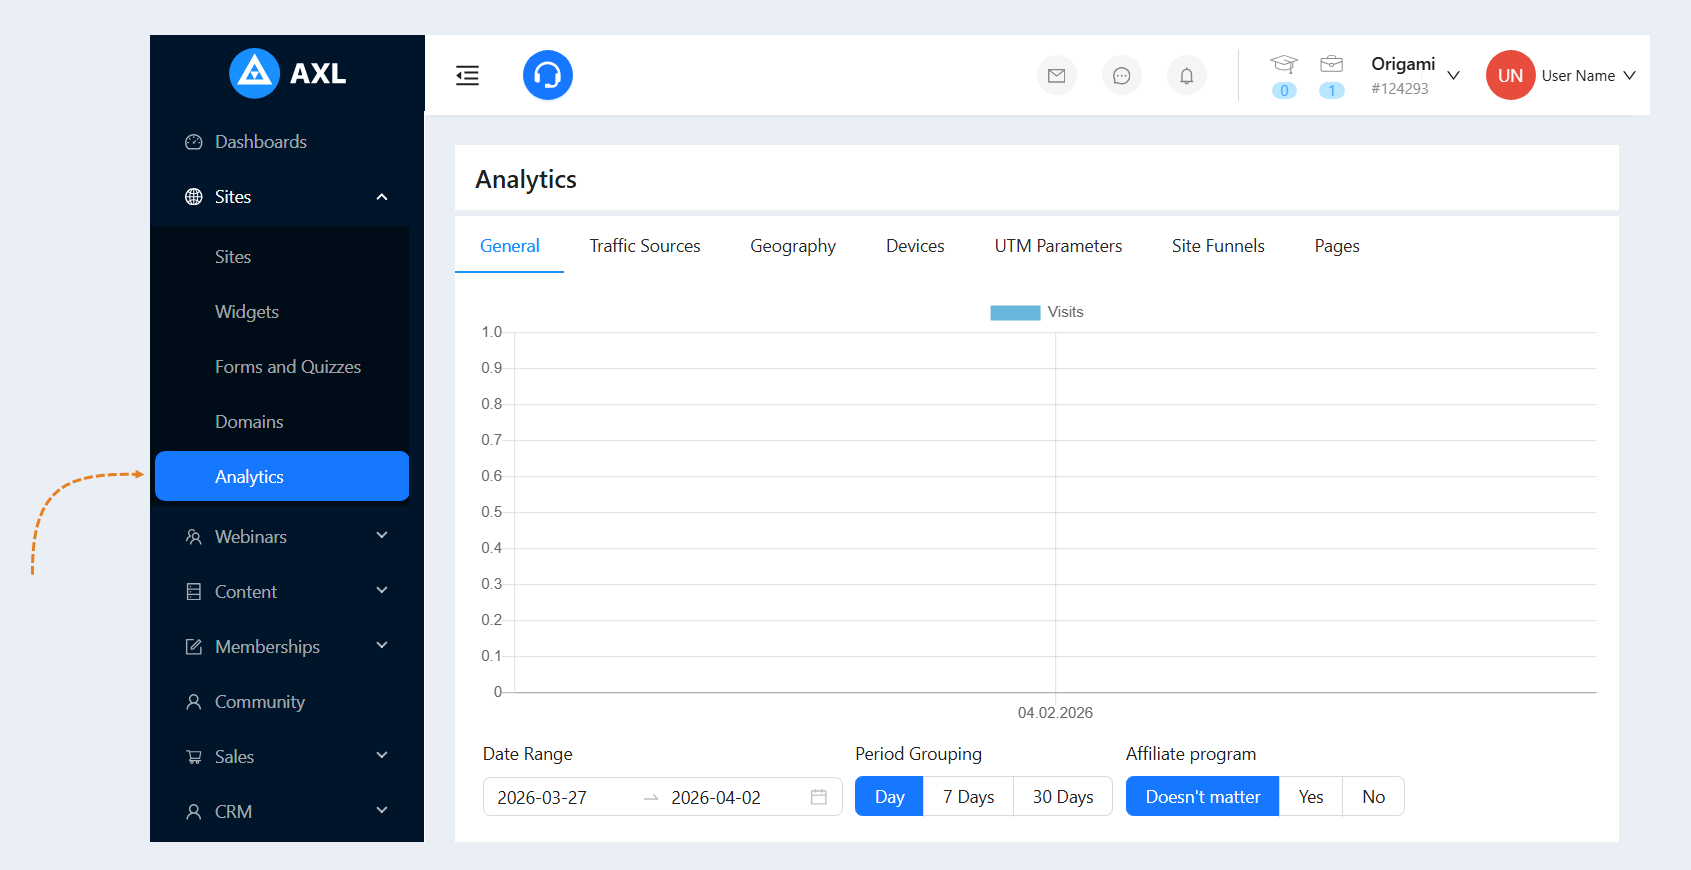
Go to the "Analytics" section. Select the "Site traffic analytics" tab.
You will see a page with detailed traffic analytics for your sites. At the top of the page is a graph of attendance, at the bottom of the page - digital attendance.
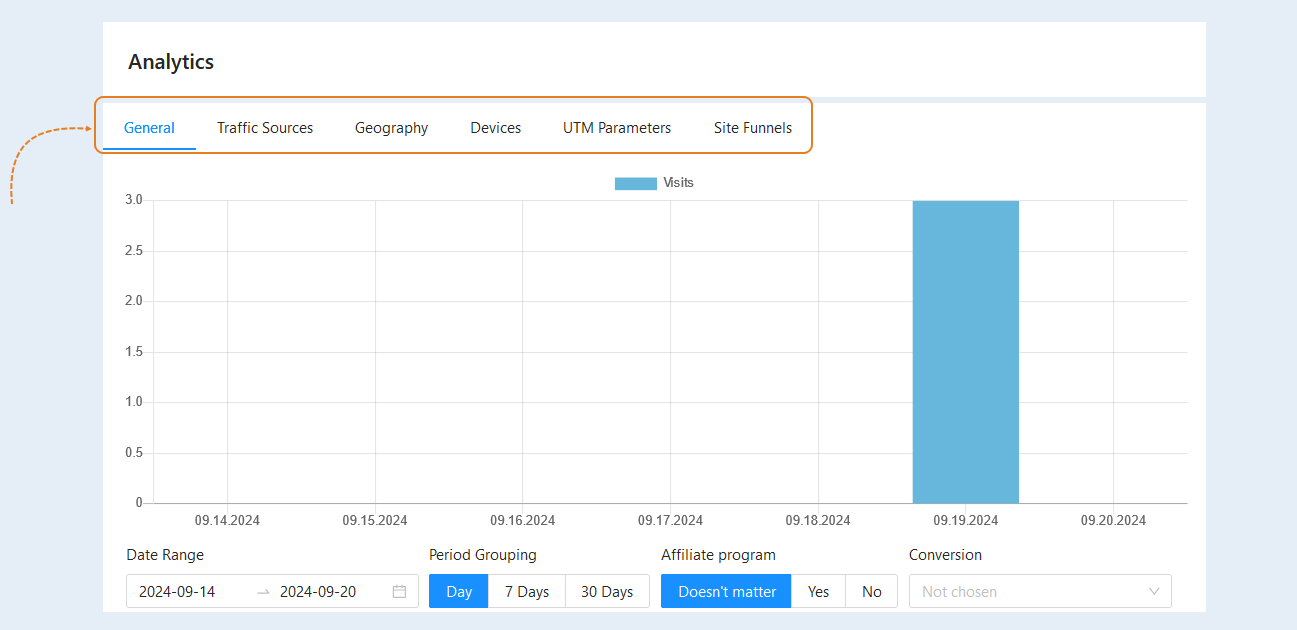
Tabs at the top of the page:
- General. Here you'll find overall traffic analytics. It helps track the general traffic dynamics, identify trends (growth, decline, stability), and quickly assess the overall effectiveness of your websites.
- Traffic source.This tab displays the sources of referrals to your websites. It helps determine which traffic channels are most effective. This allows you to focus resources on the most profitable channels and improve strategies for less effective ones.
- Geography. Here you can see the geography of visitors – the countries and cities from which they accessed your page. It helps you understand in which regions your website is most popular. This information can be used to target advertising campaigns to specific regions, adapt content to specific audiences (e.g., offer different language versions of the website or consider cultural characteristics).
- Devices. This tab shows the devices that visitors use to access your websites. It helps you optimize your website for various devices.
- UTM parameters. Here you can see the sources of visits by the keywords you added to the page address. UTM tags allow you to know exactly which advertisement/link brought the user to the site. This allows you to evaluate the effectiveness of individual campaign elements (banners, email newsletters).
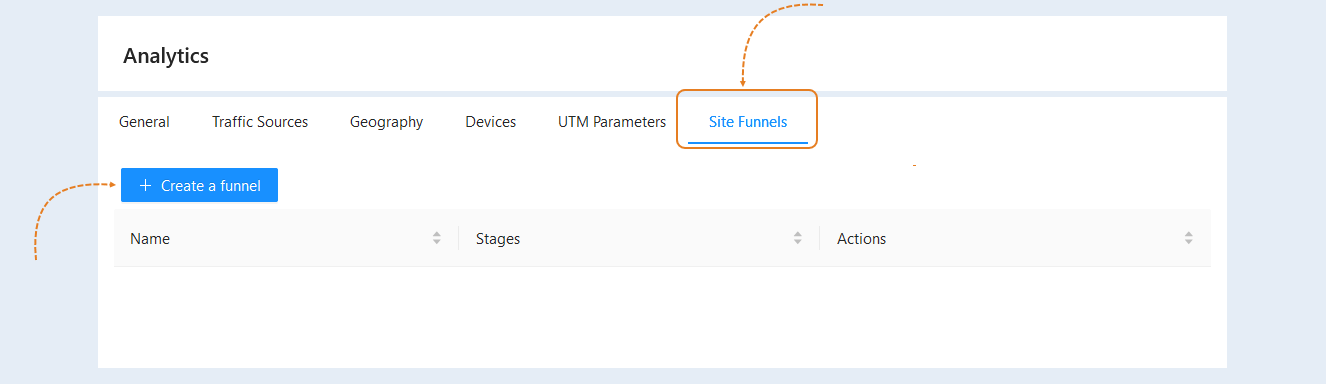
Site Funnels. In this tab, you can create funnels for website analytics. Track user behavior to increase conversion to leads. This section helps optimize user experience and increase conversions. You can see at which stage of the order process or form completion users most often drop off. This section is described in more detail below.
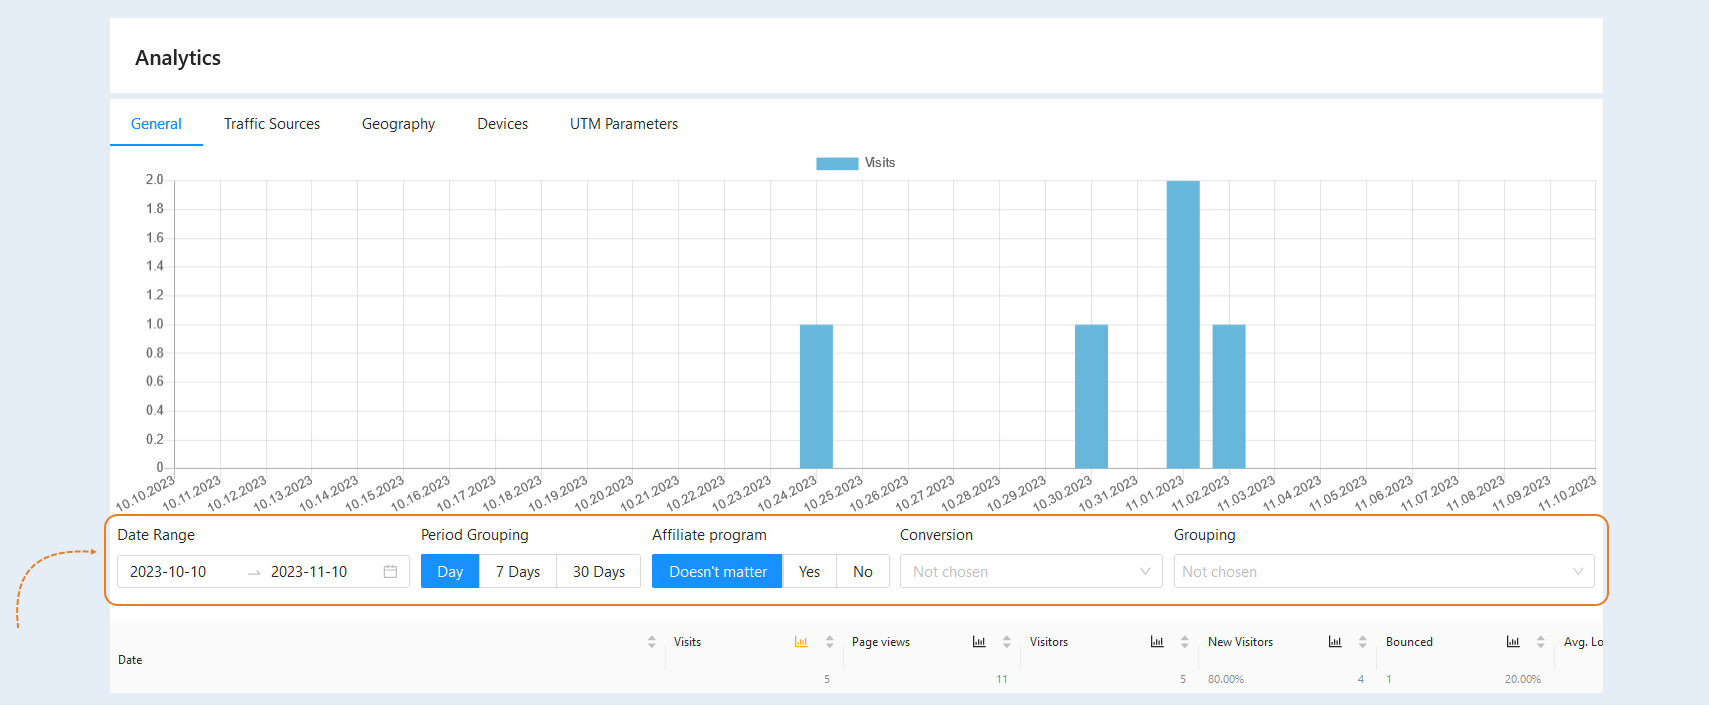
Below are the search strings:
- Date range. Set the period for which you want to view the data. This indicator determines the time frame for which you want to see statistics. This is a key element, as it allows you to analyze trends, compare periods (e.g., this week with last week), and track changes in traffic and conversions after specific events (e.g., launching an advertising campaign).
- Grouping by periods. Choose the period value: day, 7 days, 30 days. Determines how the data is aggregated within the selected date range. Instead of displaying each individual record, the data is grouped according to the selected periodicity.
Affiliate program. In website analytics, you can view traffic by affiliate program. You can choose to analyze traffic only from the affiliate program, exclude the affiliate program from analytics, or view the overall traffic. Allows you to track the effectiveness of your affiliate program by separating traffic coming from partners from the rest of the traffic on the website.
- Conversion. Choose an action from the list: form submission, webinar registration, added to cart, registration via chatbot, purchase, order created, contact created, order paid. Focuses analytics on specific actions that you consider to be targets (conversions). Allows you to measure how many users have performed a specific action on the site.
- Grouping. You can select one or more values from the list to filter the data. And also change their places in the search bar to change the level of data filtering in the list. Allows you to filter data by various parameters to obtain more detailed information about your audience and their behavior.
Below is a table with numerical attendance indicators:
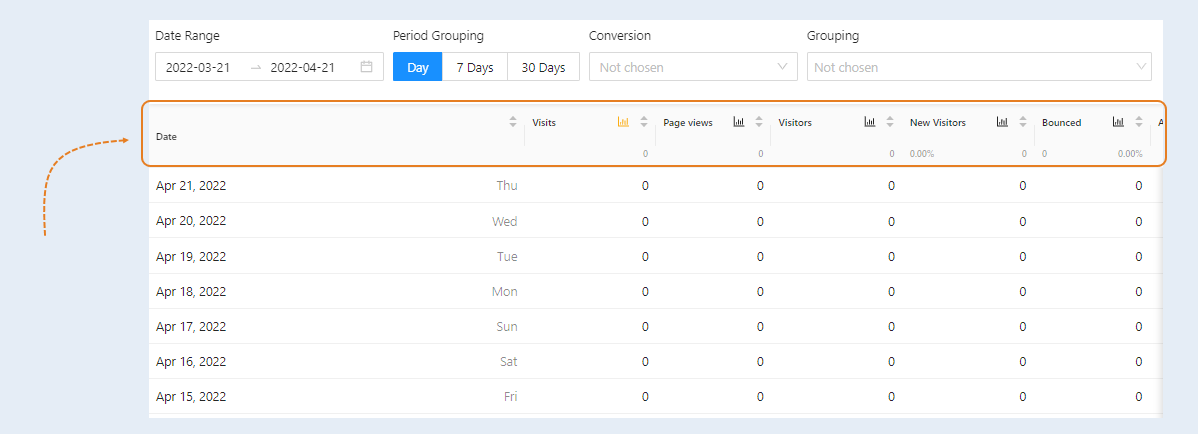
Date. The date of the user's action is indicated. The values in this column will change depending on the selected search term (grouping). For example: traffic sources, geography, devices, etc.
Visits. A visit is a new session on the site. The system recognizes the session as completed if the user does not perform any actions on the site within 30 minutes or when midnight comes. This column shows the number of visits per page.
Page views. Browsing is the browsing of pages within a single user session. This column shows the number of page views (including repeat views).
Visitors. A visitor is a guest who has clicked through to the site. Data about it is stored for 30 days. This column shows the total number of unique visitors on the page (the number of people is counted here, not the number of views).
New visitors. A new visitor is a guest who has visited the site page for the first time. The system also recognizes a visitor as a new one if he visits the site from another device or browser. This column shows the number of new visitors for the specified period and the percentage of the total number of visitors.
Bounce. Bounce is the closing of the page by the visitor after 15 seconds or less, if there was no event (the visitor did not perform any action on the page). This column shows the total number and percentage of the total number of visitors.
Average loading time. The average page loading time is indicated.
Average time. The average time spent on the visitor's site is indicated. Average time a visitor spends on the site.
Site Funnels
The "Site Funnels" section is designed to track and analyze user behavior on the website and to optimize conversion-related processes. Funnels show how users navigate through the site, starting from their first contact and ending with a target action (such as a purchase or registration). This helps to identify at which stages users drop off and what actions they take.
By understanding where users are lost, one can implement changes and improvements. For example, if many people create orders but do not complete the purchase, this may indicate that the checkout process is too complicated or that users may lack confidence in their choice due to insufficient product information.
Understanding how users interact with different stages of the funnel allows for changes to be made to increase the conversion rate.
Open the "Site Funnels" tab and click the "Create a Funnel" button.
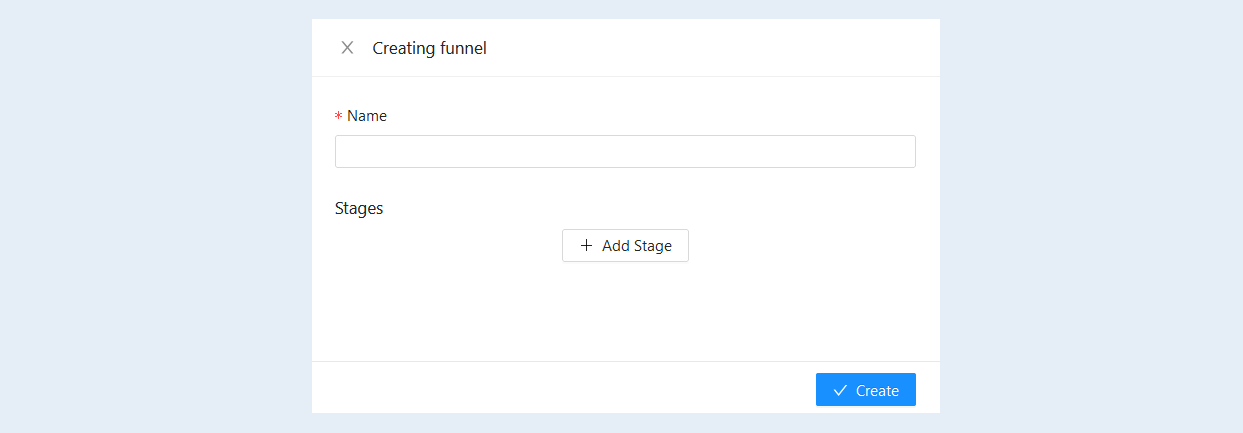
In the dialog that appears, enter the name of the funnel and click the "Add Stage" button.
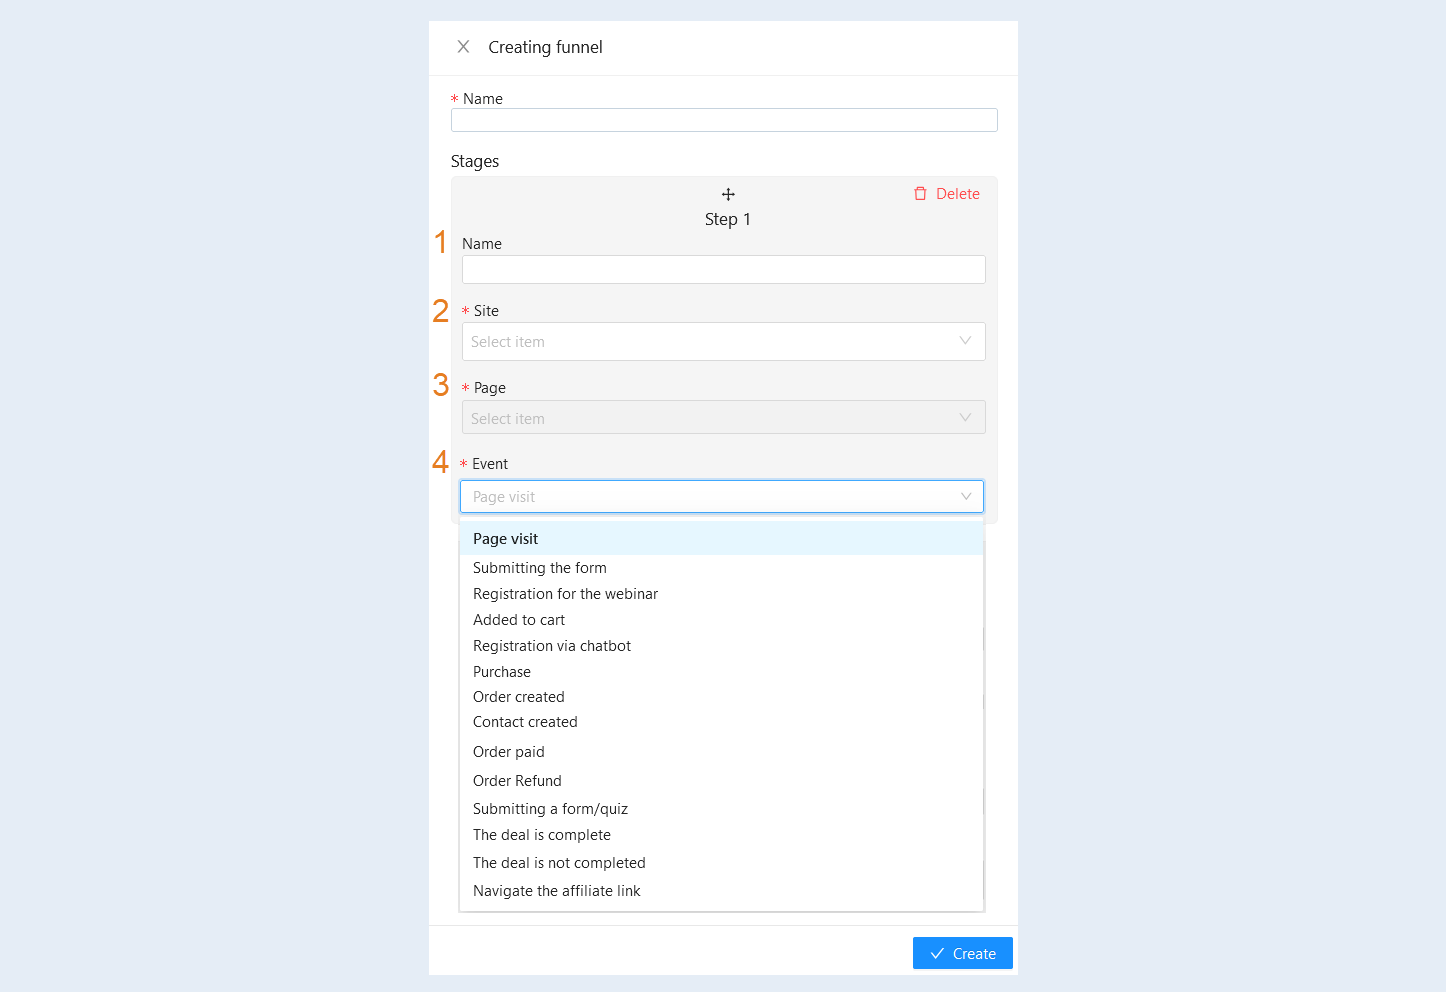
A stage configuration window will open below. Fill out the fields:
- Name. Specify the name of the funnel stage.
Site. Select from the list the site on which you want to track user actions. For more information on creating a site on the AXL platform, read the article "How to Create a Website".
Page. Select the webpage from the list.
Event. Choose from the suggested list the event that the user performs on the webpage.
- Page Visit. A user simply visits a specific page on your website (e.g., homepage, product page, contact page). This is a starting point to understand how many people begin their journey towards your goal.
Submitting the form. A user fills out and submits a form on the website (e.g., contact form, newsletter subscription form). This indicates the user's interest in receiving more information or further engagement.
Registration for the webinar. A user registers to attend a webinar. This demonstrates interest in your content and expertise.
Added to Cart. A user adds a product or service to the shopping cart of an online store. This is an important step towards a purchase. If many people add items to their cart but don't complete the purchase, it could indicate issues in the checkout process.
Registration via Chatbot. A user signs up for interaction with your chatbot. This allows you to automate answering questions and engage users.
Purchase. A user completes a purchase. This is a key event that shows how many users have completed the buying process.
Order Created. A user creates an order in an online store but has not yet paid for it. This is the step before payment and allows you to analyze at which stage users are stopping.
Contact Created. A user leaves contact information, and their details are added to your CRM system. Tracking the number of leads (potential customers).
Order Paid. A user successfully pays for their order. This is the final confirmation of a completed purchase.
Order Refund. A user initiates a return of a product/service. Tracking the number of returns allows you to assess product quality, accuracy of product descriptions, delivery convenience, customer service quality, and other factors affecting customer satisfaction.
Submitting a Form/Quiz. A user fills out and submits a form/quiz on the website. This helps assess audience engagement and interest, as well as collect data for lead qualification.
The Deal is complete. A deal with a customer has been successfully closed. This shows how many leads have converted into real customers.
The Deal is not completed. A deal with a customer was not closed (e.g., the customer declined the service). This helps understand the reasons why customers are declining and optimize the sales process.
Navigate the affiliate link. A user clicks on a link placed by your affiliate and lands on your website. This allows you to assess the effectiveness of affiliate programs.
Purchase trial subscription. A user subscribes to a free trial of your product. This is the first step towards a paid subscription and allows you to assess interest in the product.
Configure the desired number of funnel stages by adding new stages. Once you complete the settings, click the "Create" button.
The funnel you created will appear in the list. Here, you can see the information:
- Name. The name of the funnel is displayed. Click on the funnel name to open its details.
Stages. The number of stages within the funnel is indicated.
Actions. The following buttons are available:
"Edit" button. Click to make changes to the funnel.
"Delete" button. Click to delete the funnel.
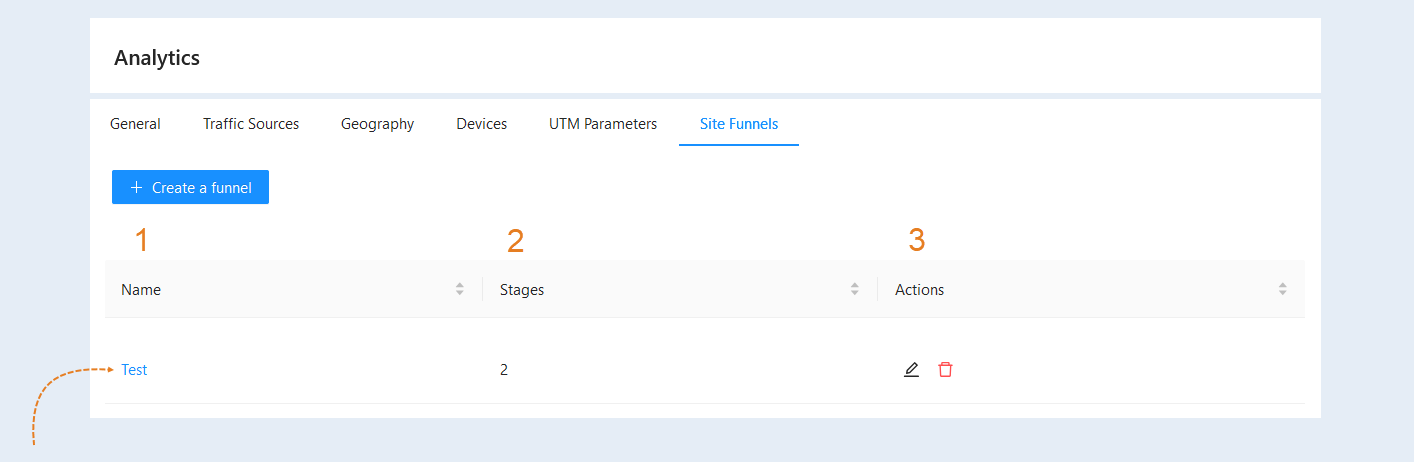
Click on the funnel name to open its details. In the window that opens, you will see:
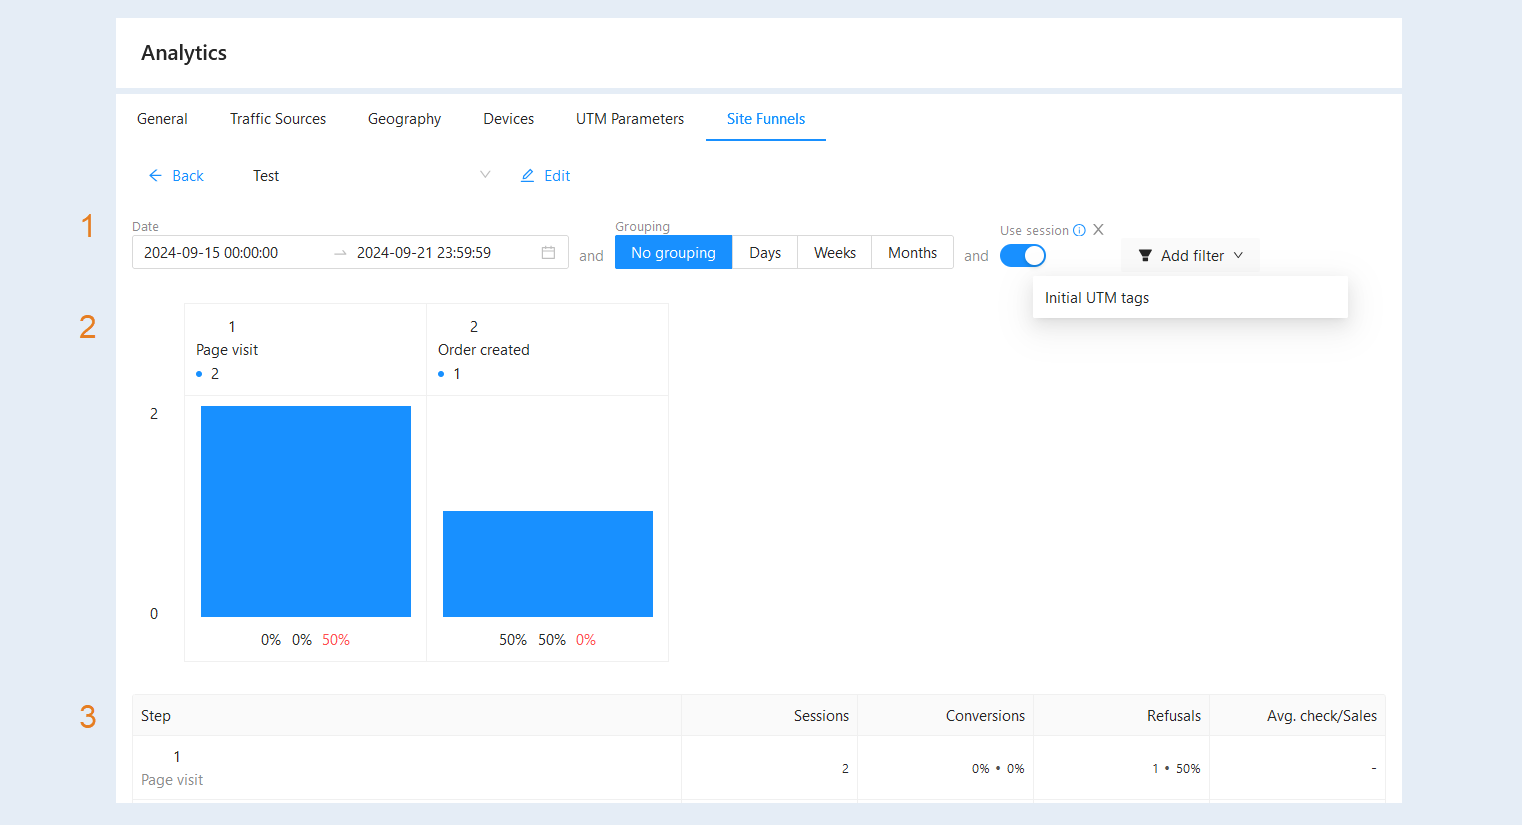
- At the top, you have access to the filters:
- Date. Set the period for which you want to view the data.
Grouping. Choose the time period for grouping data: days, weeks, months, or no grouping.
Use Session. If the toggle is in the "on" position, only transitioning guests and conversions from the first to subsequent events will be considered.
Initial UTM Tags. You can specify a UTM tag value to filter only those events where associated contacts came to your site through that UTM tag. Choose from the list of initial UTM tags.
On the graphs, you can see visual statistics for each stage of the funnel.
In the table, you can see:
Sessions. The total number of user sessions at each stage.
Conversions. The percentage of users who completed the target action (e.g., a purchase or registration).
Refusals. The number and percentage of users who left the site without completing the target action.
Avg. check/Sales. Information about the average purchase size or total sales amount at each stage.